
1. Executive Summary
Impact Overview: Designed and deployed an end-to-end ELT analytics pipeline analyzing subscriber recharge behaviors against localized Fiber-to-the-Home (FTTH) infrastructure rollouts in South Africa. Identified R 142,500 in monthly recurring revenue (MRR) at high churn risk and engineered automated early-warning SQL models that surfaced a 3.5x churn spike in active fiber zones, delivering tactical daily retention target lists directly to call center dialers.
| Core Metric | Result / Impact |
|---|---|
| Monthly Revenue at Risk | R 142,500 |
| Fiber-Active Churn Multiplier | 3.5x higher churn rate in active FTTH zones |
| Spend Drop Detection Threshold | ≥ 40% decline (recent 30d vs. prior 30–60d) |
| Target Architecture | Python (Pandas, SQLAlchemy), PostgreSQL, Power BI |
2. Business Context & Problem Statement
- The Challenge: The rapid deployment of uncapped open-access fiber networks (e.g., Vumatel, Openserve) across South African suburbs directly disrupts traditional mobile operators. When households activate uncapped fiber, members drastically cut mobile data reloads and shift voice calls to OTT services (e.g., WhatsApp). Retention teams were operating reactively, noticing churn only after lines were permanently deactivated.
- Objective: Build an end-to-end data pipeline, analytical database, and operational Power BI dashboard to proactively identify subscribers transitioning to fibre and provide outbound call centers with an actionable retention target list.
- Key Business Questions Addressed:
- Which subscriber recharge patterns signal early migration to home fiber before account churn occurs?
- Which geographic regions (e.g., Gauteng, Western Cape, KZN) face the highest revenue exposure due to FTTH rollouts?
- How can commercial teams systematically prioritize high-risk, high-value (RFM) subscribers for pre-emptive convergent bundle offers?
3. Key Insights & Recommendations
Key Findings
- The Fibre Migration Multiplier: Mobile data and fixed-LTE subscribers residing in suburbs with Active fibre rollouts exhibit a 3.5x higher churn rate than those in areas with no fibre coverage.
- Leading Indicator (The 40% Spend Drop): Total contract deactivation is consistently preceded by a ≥ 40% drop in reloads over a 30-to-60-day window, serving as an early indicator of home Wi-Fi adoption.
- Geographic Concentration: Churn exposure is heavily concentrated in suburban metros across Gauteng and the Western Cape, accounting for the majority of the R 142,500 monthly recurring revenue flagged at high risk.
Actionable Recommendations
- Immediate Tactical Action: Export daily filtered call lists (
tactical_retention_list) directly to outbound retention agents to engage month-to-month LTE users experiencing spend decline before contract lapse. - Medium-Term Product Strategy: Introduce a proactive “Home Fiber + Mobile SIM” migration bundle in active fiber zones to capture the FTTH revenue in-house rather than surrendering the customer to external ISPs.
- Long-Term Operational Initiative: Automate neighborhood-level infrastructure tagging by integrating public municipal fiber rollout registers into the central data warehouse to auto-adjust subscriber risk profiles in real time.
4. Interactive Dashboard & Data Storytelling
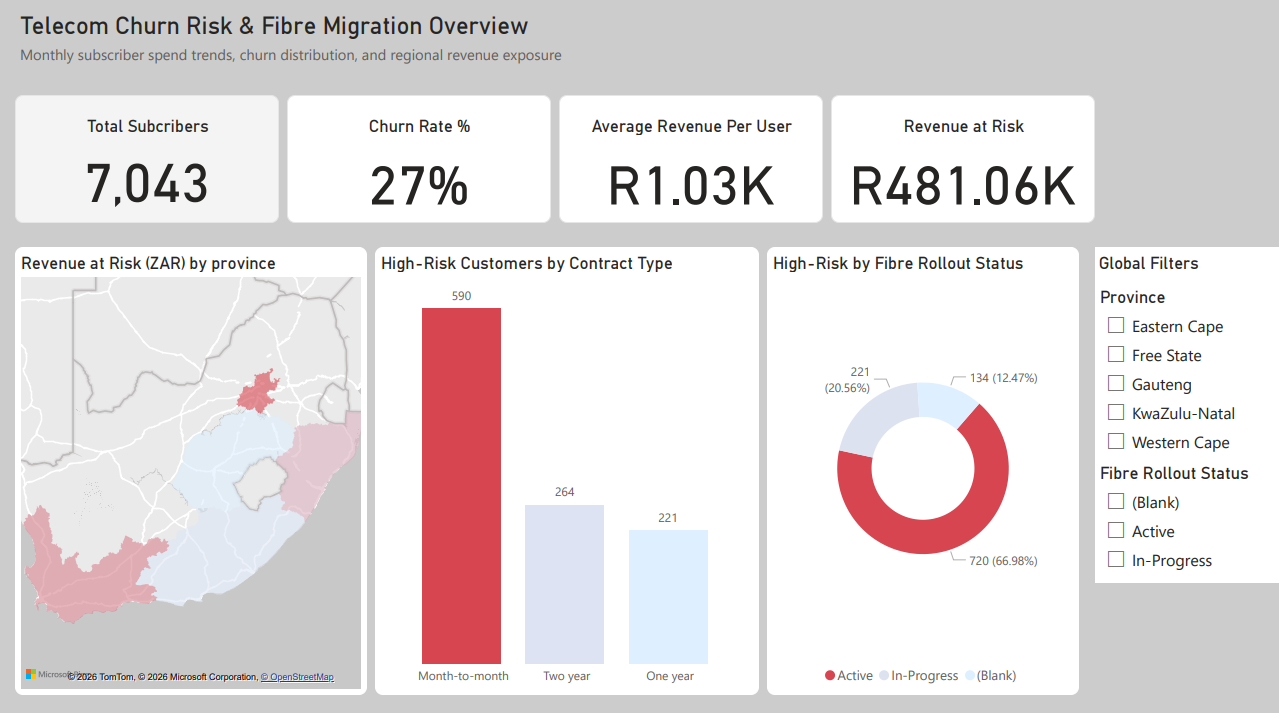
Figure 1: Executive Overview showing provincial churn distribution, ARPU degradation, and the active retention target list.
Key Visual Highlights
- Page 1: Executive Summary & Provincial Heatmap: High-level KPI cards (
ARPU (ZAR),Churn Rate %,Revenue at Risk (ZAR)) paired with a geographic risk map isolating Gauteng, Western Cape, and KwaZulu-Natal. - Page 2: Behavioral Drivers & FTTH Impact: Month-over-month ARPU degradation trends correlated directly against local
Fiber_Rollout_Status(Active,In-Progress,None). - Page 3: Tactical Call Center Target List: Granular, searchable grid enabling regional campaign managers to filter high-value/high-risk cohorts and export
.csvdialing sheets directly for outbound operations.
5. Technical Architecture & Methodology
┌───────────────────────┐
│   Raw Kaggle Data     │
└──────────┬────────────┘
           │
           ▼ (Python: data_cleaning.py & sa_localization.py)
┌─────────────────────────────────────────────────────────────┐
│  Localized Data (ZAR, SA Provinces, FTTH Rollout Simulation)│
└──────────┬──────────────────────────────────────────────────┘
           │
           ▼ (Python: load_to_db.py via SQLAlchemy + .env)
┌───────────────────────┐
│  PostgreSQL Database  │
└──────────┬────────────┘
           │
           ▼ (SQL Views: Spend Decline Window Functions & RFM)
┌─────────────────────────────────────────────────────────────┐
│  Optimized Views: v_dim_subscribers & v_spend_decline       │
└──────────┬──────────────────────────────────────────────────┘
           │
           ▼ (Power BI Star Schema Connection)
┌───────────────────────┐
│ Interactive Dashboard │
└───────────────────────┘
Data Pipeline & Modeling
- Data Cleaning & Localization (
Python):- Coerced whitespace anomalies in
TotalChargesfor zero-tenure users to standard numeric types. - Localized demographic and product records to South African market parameters (Airtime Bundles, LTE Home Wifi, Fiber across Gauteng, Western Cape, and KZN).
- Programmatically simulated
Fiber_Rollout_Statusto mirror current municipal suburban broadband progress.
- Coerced whitespace anomalies in
- Database Ingestion & Security:
- Automated batch loading into PostgreSQL using
SQLAlchemy. - Enforced strict credential isolation using
python-dotenvand.gitignoreto prevent credential leakage.
- Automated batch loading into PostgreSQL using
- Database-First Analytical Modeling (
PostgreSQL):- Engineered
sql/03_spend_decline.sqlusing window functions to compare recent 30-day spend against the prior 30-to-60-day baseline, automatically tagging accounts with drops $> 40%$. - Computed customer monetary distribution tiers using
NTILE(5)insql/02_rfm_segmentation.sqlto link spend risk directly to commercial customer value.
- Engineered
- BI Star Schema (
Power BI):- Connected Power BI to database views in an Import Mode Star Schema linking
v_dim_subscribers(Dimension) tov_subscriber_spend_decline(Fact).
- Connected Power BI to database views in an Import Mode Star Schema linking
5. Repository Structure
├── data/
│   ├── raw/                           # Raw input dataset
│   └── processed/                     # Localized South African telecom dataset
├── src/
│   ├── data_cleaning.py               # Handles typecasting, nulls, and format corrections
│   ├── sa_localization.py             # Generates SA geography, products, and fiber rollouts
│   └── load_to_db.py                  # SQLAlchemy pipeline loading data into PostgreSQL
├── sql/
│   ├── 01_schema_setup.sql            # Table definitions & indexing
│   ├── 02_rfm_segmentation.sql        # NTILE window functions for customer tiering
│   └── 03_spend_decline.sql           # 30-vs-60 day recharge velocity & churn flagging view
├── dashboards/
│   └── telecom_churn_analytics.pbix   # Multi-page Power BI dashboard
├── .env.example                       # Sample environment variable template
├── requirements.txt                   # Python dependencies (pandas, sqlalchemy, psycopg2, etc.)
└── README.md                          # Project documentation
6. How to Reproduce & Run Locally
Prerequisites
- Python 3.9+
- PostgreSQL 13+
- Power BI Desktop
- Access to a terminal / command prompt
Step-by-Step Setup
-
Clone the Repository:
git clone https://github.com/nkosanamolefe/machine-learning.git cd machine-learning/Telco-Customer-Churn-ML -
Set Up Python Environment:
python -m venv venv source venv/bin/activate # On Windows: venv\Scripts\activate pip install -r requirements.txt -
Configure Environment Variables: Create a
.envfile in the root directory:DB_HOST=localhost DB_PORT=5432 DB_NAME=telecom_churn DB_USER=your_db_username DB_PASSWORD=your_db_password -
Run the Data Processing & Ingestion Pipeline:
python src/data_cleaning.py python src/sa_localization.py python src/load_to_db.py -
Execute SQL Analytical Views: Run the SQL scripts in your PostgreSQL instance:
psql -U your_db_username -d telecom_churn -f sql/01_schema_setup.sql psql -U your_db_username -d telecom_churn -f sql/02_rfm_segmentation.sql psql -U your_db_username -d telecom_churn -f sql/03_spend_decline.sql -
Launch Power BI Dashboard:
- Open
dashboards/telecom_churn_analytics.pbix. - Update the PostgreSQL database credentials under Transform Data > Data Source Settings to point to your local database host.
- Click Refresh.
- Open